


Rollins Inc (NYSE: ROL)
The Best US Pest Control Company
Executive Summary
In short, ROL can yield a 25% upside on a 5-yr horizon. I believe ROL has a compelling risk to reward because it represents an opportunity to (1) invest in the leading pest control company in US that posses strong and sustainable competitive advantage which attributes to strong earnings power, (2) well-positioned to capitalize on multiple industry secular tailwinds that will accelerate growth from ~4% to 7% from 2024E to 2028E, (3) Invest alongside strong management team with exceptional capital allocation with ROIC at 24%, way above industry average of ~12% and (4) Incremental value from future acquisitions not baked into share price yet, which can further extract $5.71 of value per share.
Business 101
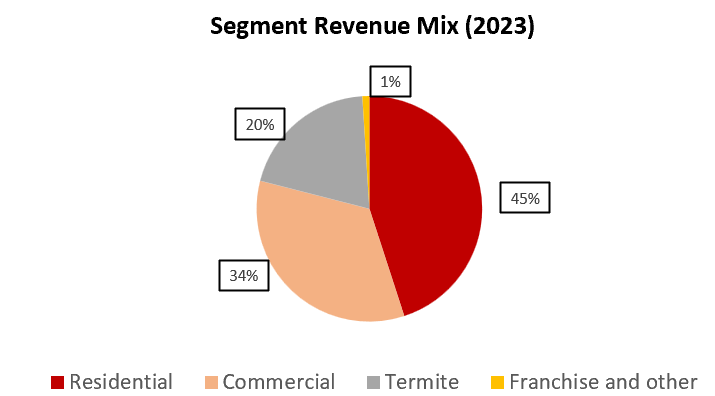
ROL provide pest control services to over 2.8m residential and commercial customers from more than 800 company-owned and franchised locations. ~93% of revenue is generated domestically. Revenue mix includes residential (45%), commercial (34%) and termite (20%), franchise (1%).
Source: Company’s Data
Customers typically sign a term contract with ROL. Depending on the type of customer, it ranges from 1-5yr, which makes revenue recurring for ROL. The company boasted a strong ~80% retention rate from having a strong customer satisfaction and loyalty across its services. Employee costs and chemical purchases are the main cost for ROL. Wages constitutes ~88% of SG&A as employees are the engine of the business quality (further explain below).
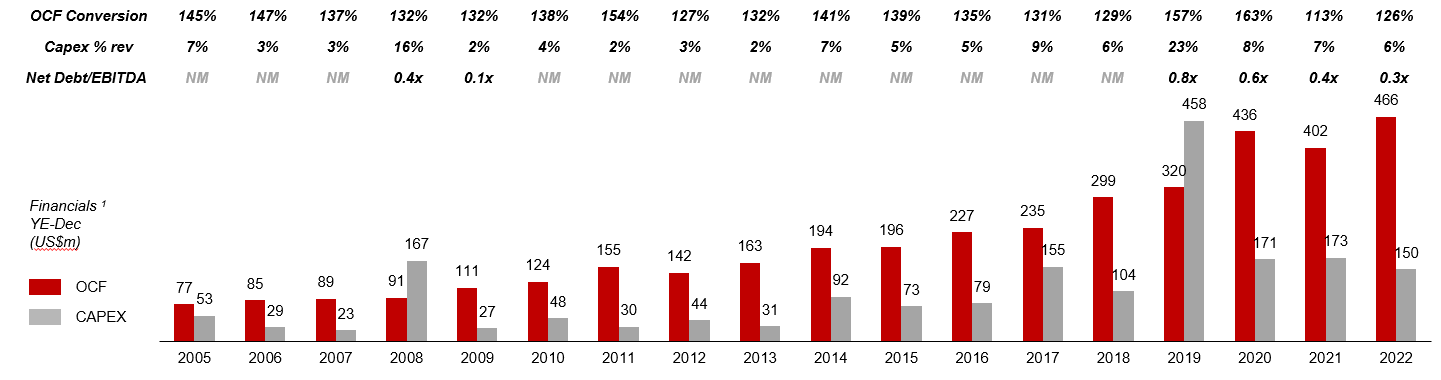
The massive scale of ROL has been driven largely by M&A, acquiring an average of 29 smaller pest control companies annually. ROL demonstrates robust FCF conversion of ~120% with net debt/EBITDA of 0.7x, enabling them to continue acquiring smaller companies, estimated to be north of ~20,000 according to management.
Source: Company’s Data
Industry Drivers
Industry growth expected to accelerate from ~4% to ~7%: (1) Climate change results in higher temperature which drives pest growth, (2) Growing upper-middle class expectation and spending continues and (3) Population migration to sunbelt states in the US.
(1): Temperature growth outpacing any other period historically. No. of days with average temperature >50 degrees nearly doubled. Higher temperature results in longer breading period and pest season.
(2): With rising education and income, people are expected to be able to afford and demand higher sanitation standards. Median household income up 5.4% in 2023 from 2022 and expected to continue increasing in the long-term.
(3): Domestic migration to sunbelt states, driven by lower tax rates, cost of living and higher quality of life that appeals to both the young and old. Population in those states expected to grow by 13% in 2030.
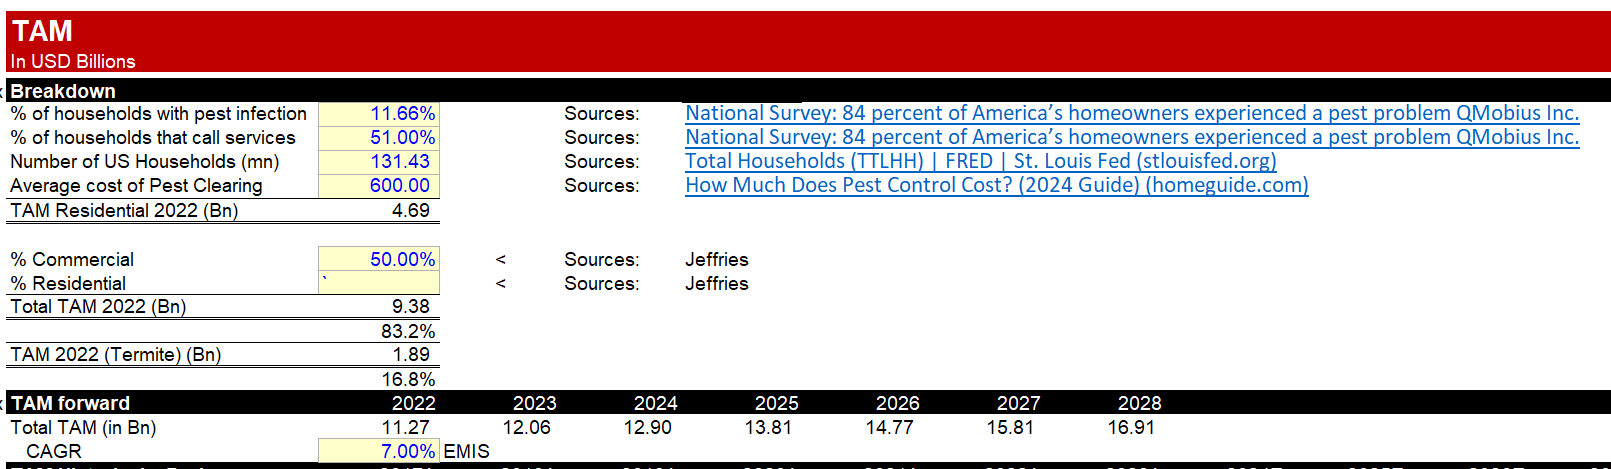
TAM Calculation
Competitive Advantages
ROL is a world class business: (1) Low barrier to entry but high barrier to scale from strong customer relationships, (2) Better operation efficiency compared to peers.
(1) Low barrier to entry but high barrier to scale: ROL continue to gain market share, by 1% on average yoy. They are the second largest pest control company in US after Rentokil (LSE: RTOL) acquired Terminix and became the number 1 pest control company in market share back in 2022. Starting a pest control business is relatively easy and inexpensive on paper (delivery vans/trucks, license, supplies etc), however, newcomers face a brutal fight against over 20,000 other pest control operators in the US. Building trust and relationship with customers take years, and with industry giants like ROL and ROTL occupying more than half the market, it is a tough nut to crack for these new players.

Source: Company’s Data, My estimation
ROL median employee salary is $49,099 whereas RTOL stands at $42,792 USD which explains why ROL has a higher employee retention rate of more than 90% while RTOL is at ~84%. Higher employee welfare > higher employee retention rate > employee continues to forge relationships with customers > higher customer retention rate > higher customer LTV and organic growth.

Source: Company’s Data
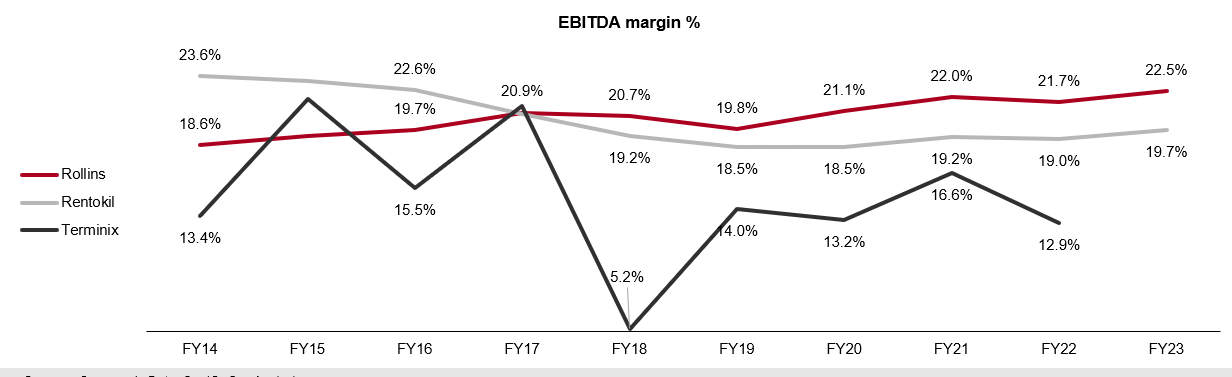
(2) Better operational efficiency compared to peers: ROL and RTOL might share the same scale advantage, but if we were to compare their EBITDA margins (see appendix 3), ROL is several points higher than RTOL. Orkins, which is ROL’s flagship store, has ~20 employees per branch compared to Terminix, which was acquired by RTOL has ~30. This shows ROL can optimize their route density better than competitors.
Source: Company’s Data
Why is this so? It boils down to consistent innovation and good execution. We date back to 2013 when ROL implemented the BOSS-synced iPhones and VRM initiative that was fully implemented in 2016 and 2018, respectively. The initiative allows technicians to (1) facilitate customer payments and (2) to optimize technicians’ daily schedule and provide them with the most efficient route possible. ROL consistently try to improve their technology, further implementing Orkin 2.0 to enhance their technology stack and drive further operational efficiency in route optimization. On the other hand, competitors like Terminix only implemented their own version of BOSS – ServSmart a year later. Terminix also lagged ROL in other aspect of their business as well. For instance, ROL entered the mosquito market first and captured the growth of the market.
Theis 1: Strong Pricing Power and Volume Growth Enables ROL to Outperform Across Economic Cycles
Historically, organic growth outperforms GDP growth by an average of ∼2.7% (excluding abnormally from 2020 to 2022 due to COVID), driven by volume (80%) and pricing (20%) growth. In addition, revenue growth remained positive during financial crisis. The reason is simple, pests do not care about the economy. Residentials and commercials will still need to address the bugging issue of pest raiding their homes, making ROL’s business highly recurring and resilient to economy downturn.
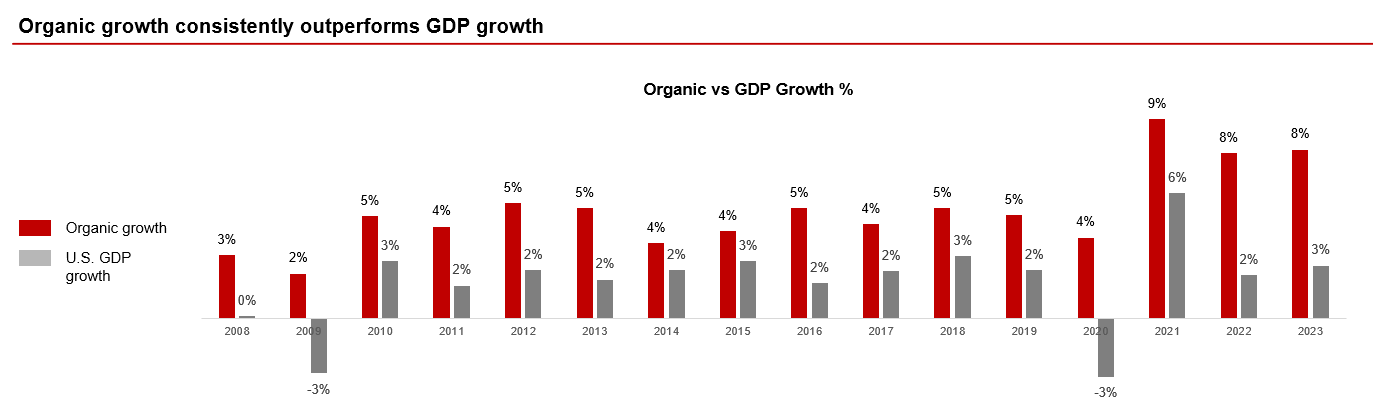
Source: Company’s Data
ROL’s competitive advantage (in scale, strong branding, and consistently high-quality service) enables them to consistently raise prices annually by ∼2% reaching peak of 4% in 2022 and 2023 to curb inflation without any significant customer churn. I strongly believe ROL can continue to sustain ∼7% revenue growth [price hike:2% and organic growth:5%].
Thesis 2: Incremental value from future acquisitions not priced in by the market
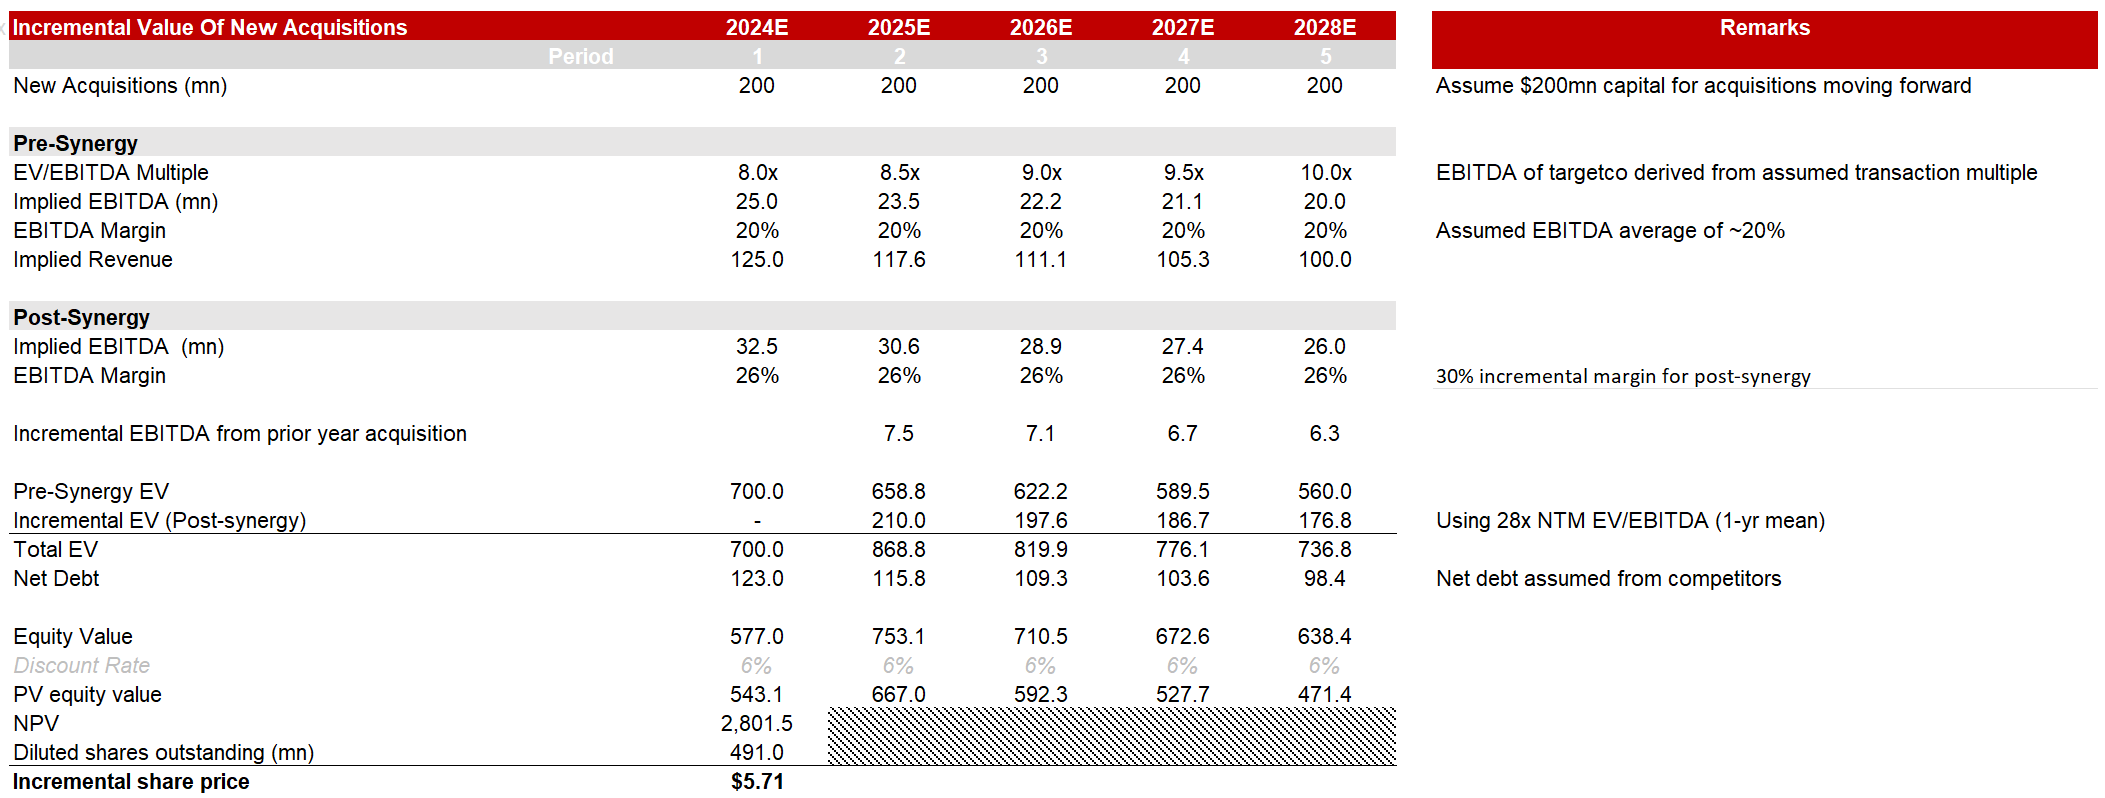
To quantify how much incremental value are there from acquisitions, I assumed $200mn (past 5 years average) capital used for acquisitions for each of the next 5 years. I assume an 8x EV/EBITDA multiple to attain our implied EBITDA, based off transaction multiple from past acquisitions.
As ROL acquires smaller companies and integrate into their core operations, a ∼30% incremental margins is typically realized (post-synergy). This implies EBITDA margin from acquired companies will increase from 20% (industry average) to 26%, implying a 28x NTM EV/EBITDA will drive incremental value per share of $5.71.
Source: Company’s Data, My estimation
Valuation
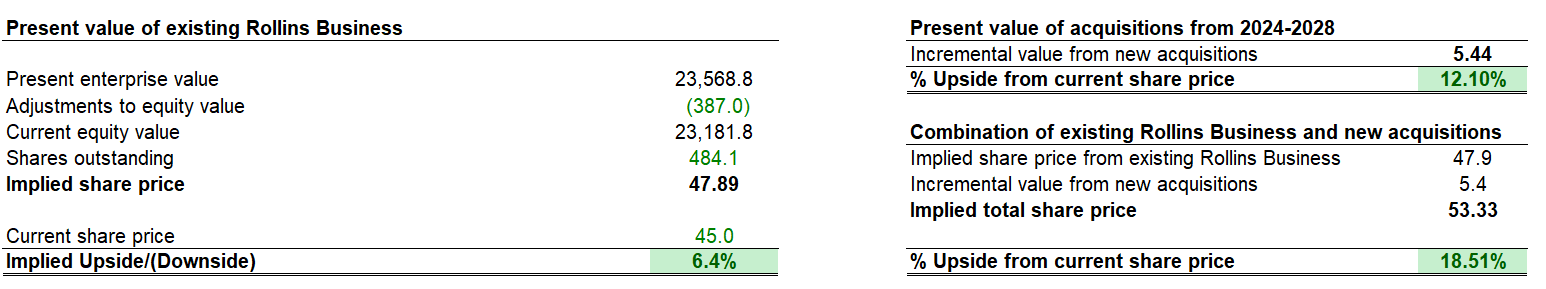
To provide a better estimation for the incremental value from future acquisitions, I valued ROL using SOTP: (1) ROL’s existing business and (2) Incremental value from future acquisitions.
Base Case yields an upside of 27.89%.
(1): I project an organic growth of 8%, factoring ROL’s sustainable competitive advantage with NTM 28x EV/EBITDA (current multiple).
(2): I assume ROL will deploy $200 USD of capital for acquisitions annually for the next 5 years with 30% incremental margin post-synergy, extracting incremental value of $5.71/share.
(3): Acquisition multiple to increase by 0.5x annually to 2028E, from 8x to 10x, factoring the increase in number of players in the industry.
Bear Case (Risk) yields an IRR of 6.99%.
(1): No change from base case.
(2): I assumed no synergies for subsequent acquisitions (incremental margins is 0%) with a derating of terminal multiple to 23x. (-1 SD 1-Yr NTM EV/EBITDA)
Bull Case yields an IRR of 36.10%.
(1): No change from base case.
(2): I assumed post-synergy of 40% incremental margins, meeting management guidance, increasing EBITDA margins from 20% to 28%. I assign a conservative estimate of 30x NTM EV/EBITDA for the terminal value, assuming no derating or rerating of multiple. With the implementation of Orkin 2.0 at its first out of fourth phases, I believe 40% incremental margins can be achievable.
Risks
I foresee 2 main risks: (1) Lack of synergies would result in no incremental margin expansion for post-synergy acquisition. The recent acquisition of Terminix by Rentokil in early 2023 is one example; post-synergy for Rentokil and Terminix are facing headwinds due to 2 very different cultures and poor route optimization, mentioned by RTOL management, and indicated by their decline in operating margins and organic growth. I foresee a possible lack of synergies from future acquisitions will result in lower incremental margins and a derate in NTM EV/EBITDA multiple from 28x to 23x (-1 SD 1-yr NTM EV/EBITDA).
(2) Macro factors such as slower in consumer demand. This might cause the stock price to react up to 8% (when RTOL announced slow in demand for their business in Q3 2023 earnings call) from macro indicators or news of slower consumer demand from competitors.